· skunxicat
On this page
Signals #5: Slicing CloudFront Logs
TL;DR: Composable shell functions for slicing CloudFront access logs locally. Filter bots from humans, identify LLM traffic, visualize in the terminal with goaccess, export JSON to Grafana. About 60% of traffic is bots.
Who actually reads your blog?
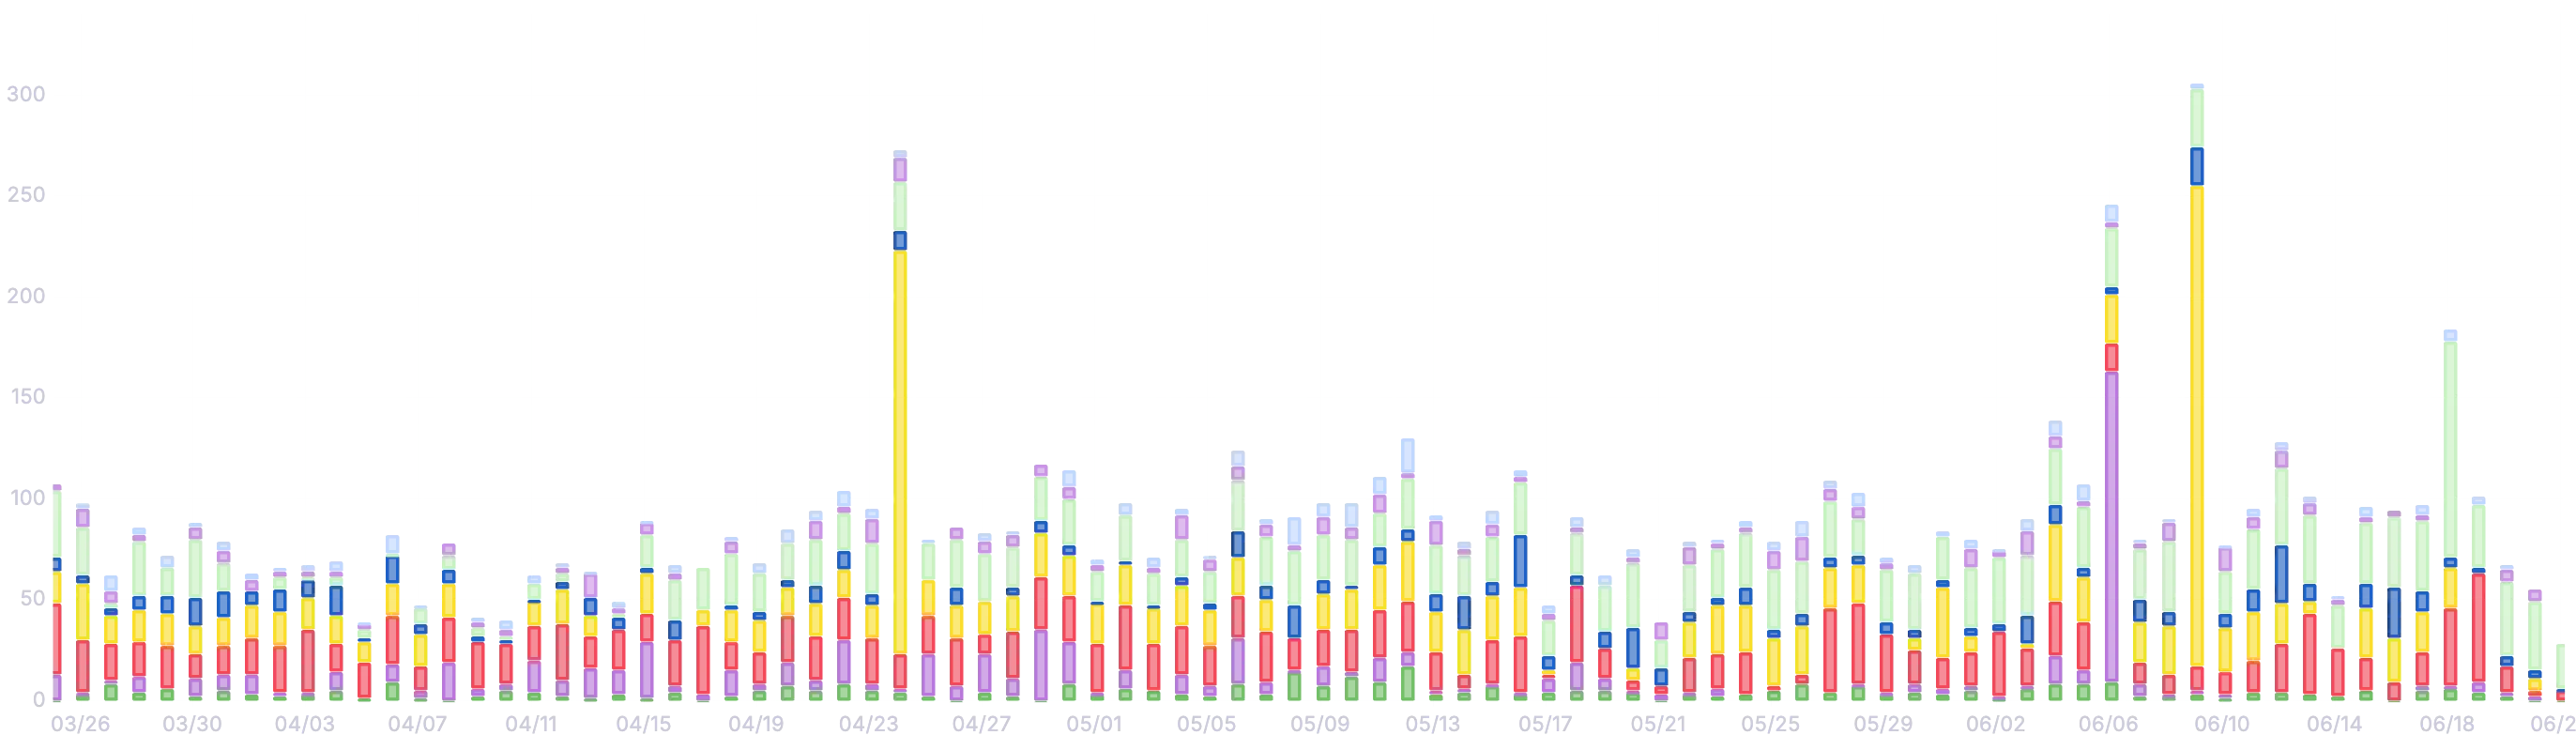
CloudFront access logs are rich — every request with IP, user-agent, status, content-type, referrer, timing. But they’re also noisy. Bots, crawlers, health checks, prefetch requests — the signal-to-noise ratio is terrible.
This signal builds composable shell filters that let you slice CloudFront logs by any dimension, visualize in the terminal with goaccess, and export JSON datasets to Grafana.
The workflow: Sync logs → Filter → Explore (terminal) → Export (JSON) → Upload (S3) → Dashboard (Grafana)
The Setup
source scripts/goaccess.sh
traffic_sync
Logs sync from S3 to a local directory. Everything runs locally — fast iteration, no cost per query, full history.
Composable Filters
The script decomposes log analysis into small, pipeable functions:
_logs ()      { ( cd "$LOGDIR" && gzcat ${CFID}.*.gz ); }
_since ()     { awk -v since="${SINCE:-0}" -v to="${TO:-9}" '$1 >= since && $1 <= to'; }
_html ()      { awk '$30 ~ /text\/html/ { print }'; }
_no_bots ()   { awk -v bot="$BOT_UA" '$11 !~ bot { print }'; }
_ua ()        { awk -v ua="$1" '$11 ~ ua { print }'; }
_referrer ()  { awk -v ref="$1" '$10 ~ ref { print }'; }
_uri ()       { awk -v uri="$1" 'index($8, uri) == 1 { print }'; }
Each function operates on CloudFront’s tab-delimited log format:
- Field
$1— date - Field
$8— URI path - Field
$10— referrer - Field
$11— user-agent - Field
$30— content-type
A shared _goaccess function handles the common flags:
_goaccess () {
  goaccess - \
    --log-format=CLOUDFRONT \
    --date-format=%Y-%m-%d \
    --time-format=%H:%M:%S \
    --no-query-string \
    --ignore-panel NOT_FOUND \
    --ignore-panel REQUESTS_STATIC \
    --exclude-ip 203.0.113.10 \
    --exclude-ip 198.51.100.42 \
    "$@"
}
Exclude your own IPs. Ignore 404s and static assets. Pass "$@" for output format override.
Traffic Functions
Each public function composes filters and pipes to goaccess:
Google Search Traffic
traffic_search () {
  _logs \
    | _referrer 'https?://(www\.)?google\.' \
    | _no_bots \
    | _html \
    | _since \
    | _goaccess --ignore-crawlers --unknowns-as-crawlers --ignore-status=404 "$@"
}
Only HTML pages. Only from Google. No bots. Date-filtered.
Human Traffic (All Sources)
traffic_non_bot () {
  _logs | _no_bots | _html | _since \
    | _goaccess --ignore-crawlers --unknowns-as-crawlers "$@"
}
LLM Consumers
traffic_llm () {
  _logs | _ua '(ChatGPT-User|Claude-User)' | _since \
    | _goaccess --ignore-status=404 "$@"
}
ChatGPT-User and Claude-User are real-time retrieval agents — they fetch pages when a user asks a question that references your content. Not crawlers. Consumers.
Specific URI Prefix
traffic_uri () {
  local uri="${1:-/}"
  [[ $# -gt 0 ]] && shift
  _logs | _no_bots | _html | _uri "$uri" | _since | _goaccess "$@"
}
traffic_uri /log/ — only blog posts.
Arbitrary User-Agent
traffic_ua () {
  local ua="$1"; shift
  _logs | _ua "$ua" | _since | _goaccess "$@"
}
traffic_ua "GPTBot" — OpenAI’s crawler specifically.
Available Functions
| Function | What it shows |
|---|---|
traffic_sync | Sync logs from S3 |
traffic_all | All HTML traffic |
traffic_search | Google organic |
traffic_non_bot | All human visitors |
traffic_uri /path/ | Specific path prefix |
traffic_ua "pattern" | Specific user-agent |
traffic_llm | ChatGPT-User + Claude-User |
traffic_claude | Claude-User only |
traffic_gpt_user | ChatGPT-User only |
traffic_gpt_bot | GPTBot (crawler) |
traffic_oai_bots | OAI-SearchBot + OAI-AdsBot |
traffic_meta | Meta external agent |
Terminal → JSON → Grafana
Every function accepts "$@" pass-through to goaccess. This is the key:
Terminal exploration:
traffic_searchInteractive goaccess dashboard in the terminal. Navigate with arrow keys. Real-time analysis.
JSON export:
traffic_search -o json | tee /tmp/search-traffic.jsonStructured JSON output: visitors, requests, referrers, countries, time distribution.
Upload to S3:
upload_dataset /tmp/search-traffic.jsonNow served via CloudFront as a static JSON dataset.
Grafana: Point Infinity datasource at the URL. Parse with JQ. Dashboard.
Date Filtering
SINCE="2026-06-01" TO="2026-06-25" traffic_searchEnvironment variables control the date range. Defaults: SINCE=2026-06-01, TO=today.
Bot Classification
The BOT_UA pattern catches the common ones:
BOT_UA='(bot|crawler|spider|crawl|slurp|scanner|...|ChatGPT-User|Claude-User|...)'But note: ChatGPT-User and Claude-User are in the bot list for traffic_non_bot (which excludes them) but have their own dedicated functions (traffic_llm, traffic_claude, etc.) because they represent a distinct, valuable traffic category.
Understanding LLM consumption of your content is a signal in itself:
- Which pages do LLMs fetch most?
- When do they fetch? (Correlates with user questions about your topics)
- What’s the ratio of LLM vs human traffic?
What I’ve Learned
From running this on cloudless.sh:
- ~60% of traffic is bots. Even for a technical blog. Without filtering, your analytics are meaningless.
- LLM traffic is growing. Claude-User and ChatGPT-User now represent measurable traffic — your content is being consumed in chat interfaces.
- Google organic is the signal. Everything else is noise for a content site. Filter to Google referrers to see what actually gets discovered.
- URI-specific analysis reveals winners. A few posts drive 80% of organic traffic. Focus there.
The Pattern
S3 Logs → Local Sync → Shell Filters → goaccess (terminal or JSON) → S3 → GrafanaLocal files, shell pipes, goaccess for both interactive exploration and structured export.
The same composable pattern as every other signal: produce a dataset, upload as static JSON, visualize elsewhere.
Tools Used
| Tool | Purpose |
|---|---|
goaccess | Log analysis + terminal visualization + JSON export |
awk | Field-level filtering on CloudFront log format |
gzcat | Decompress gzipped log files |
upload_dataset (lib.sh) | S3 upload |
| Grafana Infinity | Dashboard visualization |
Part 5 of the Signals series — small systems that observe larger systems.
Previous: Signals #4: Mapping the Terraform Module Ecosystem | Next: Signals #6: Build a Visibility Layer