· skunxicat
On this page
Signals
Small systems that observe larger systems.
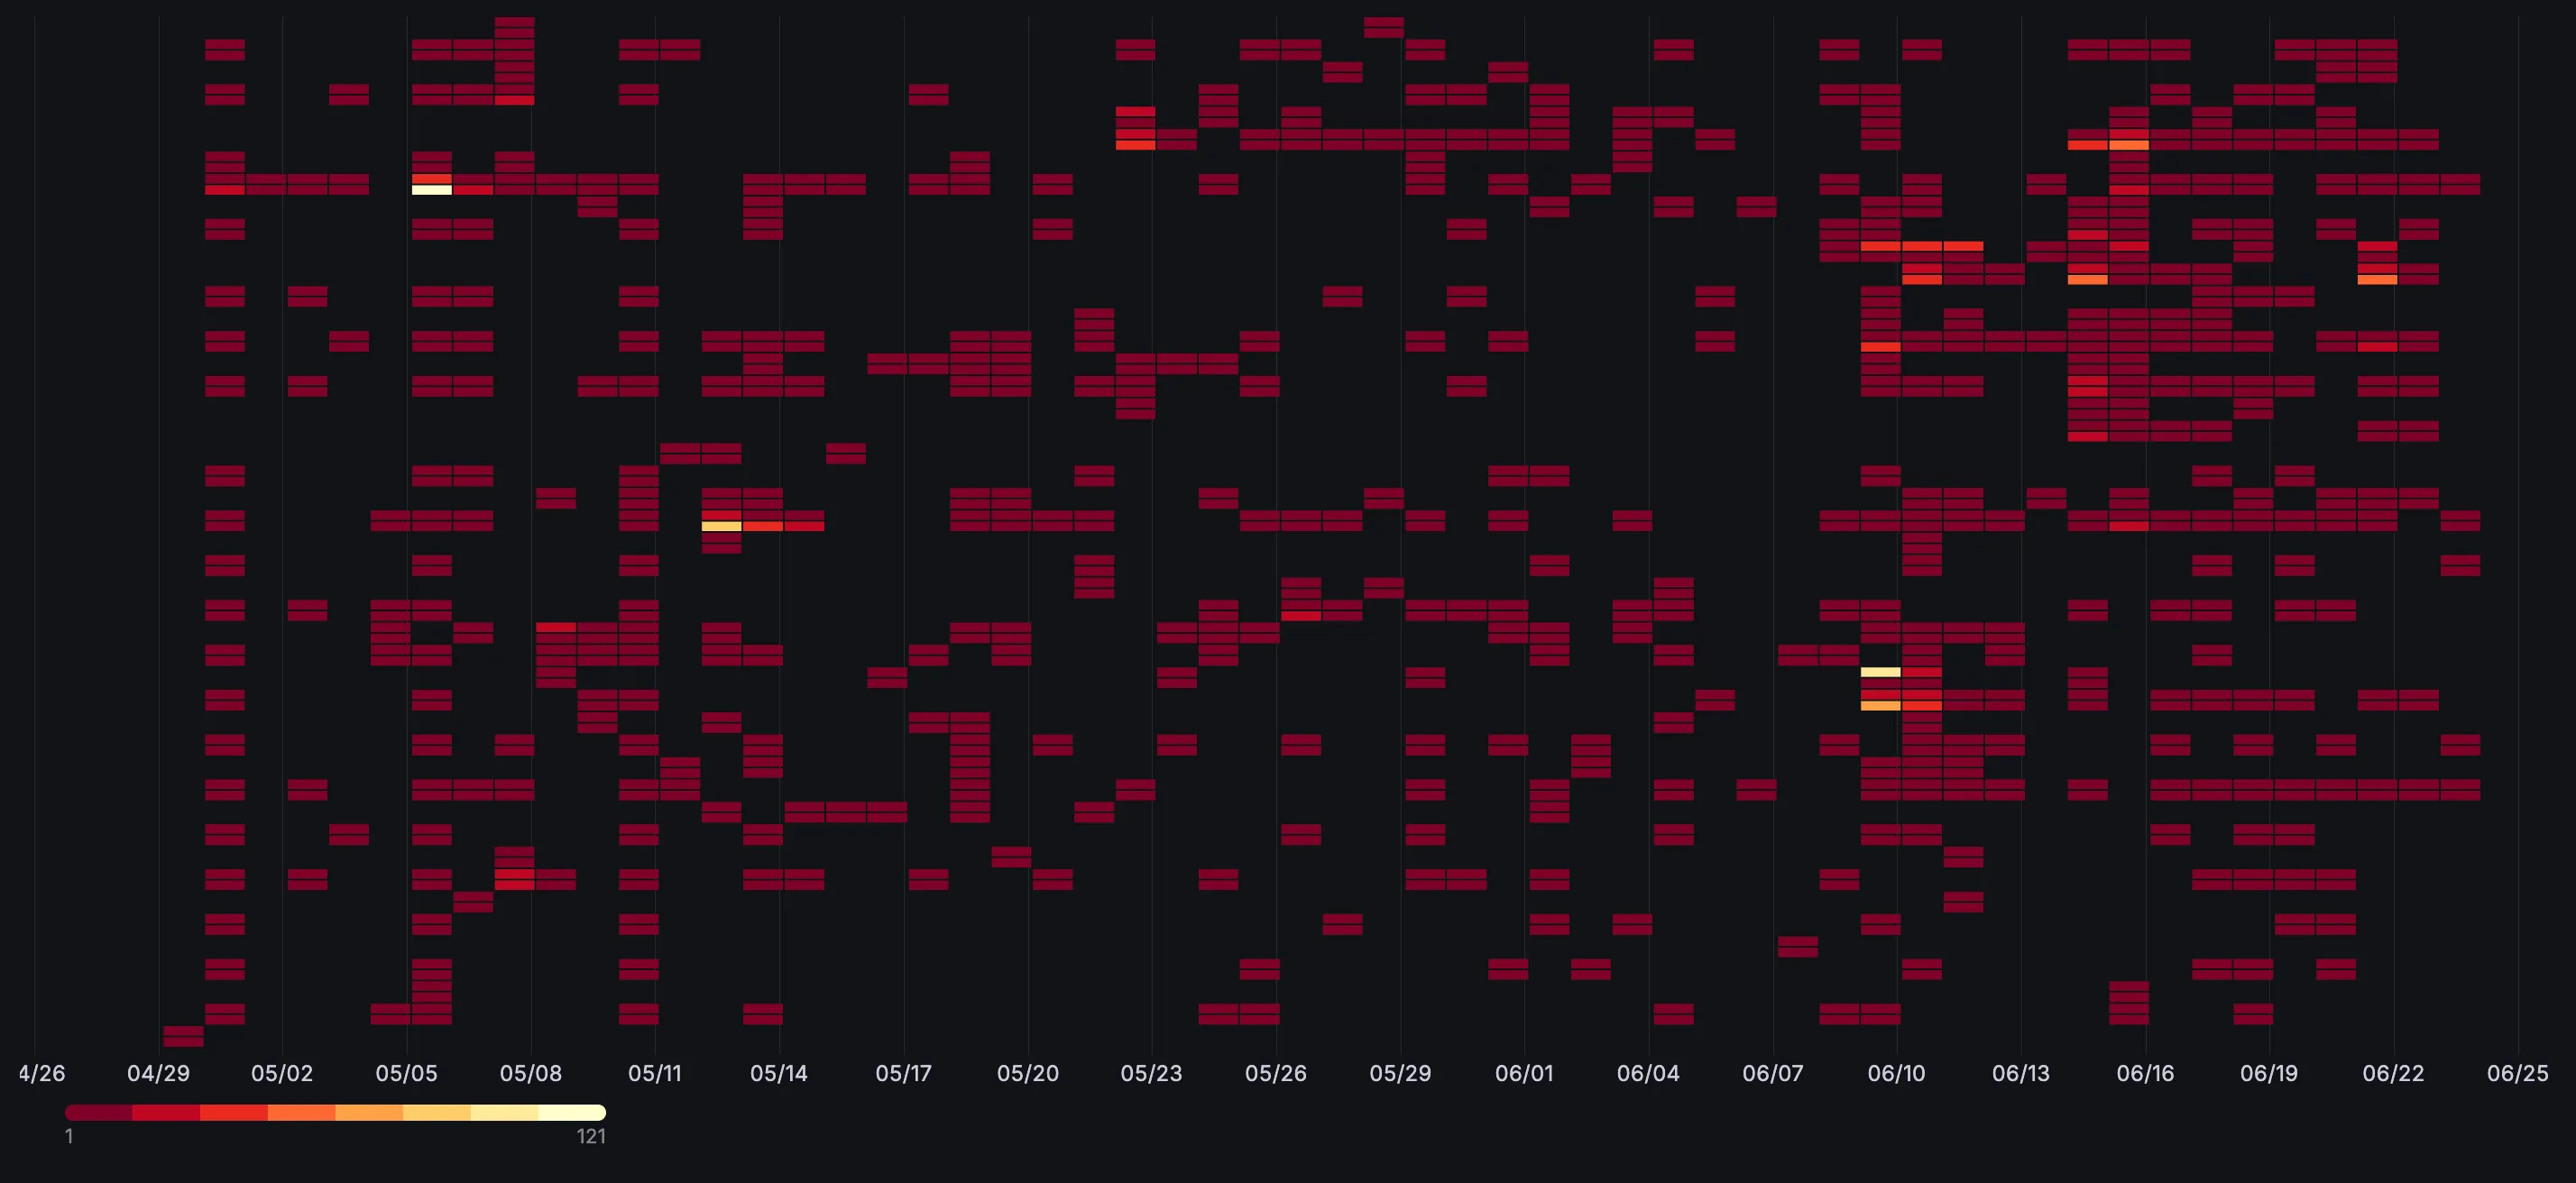
A series on building lightweight data collection pipelines. Each article follows the same pattern:
Collect → Normalize → Publish → Explore → Discover
Shell scripts produce datasets from APIs. Static JSON files land in S3. Grafana visualizes. Athena queries when you need depth.
The Method
Every signal in this series follows the same engineering instinct: prefer data that already exists over infrastructure you have to build.
CloudFront already logs every request. GitHub already exposes your commit history. The Terraform registry already has a JSON API. The question is never “how do I collect this” — it’s “how do I get out of the way and let it flow”.
Four principles run through every article:
Separate collection from interpretation. Raw data lands in S3 untouched. Meaning is added later, in the query layer — a SQL view, a jq expression, a Grafana transformation. Change the classification logic without touching the data.
Schema-on-read over schema-on-write. No ETL pipelines. No transformation jobs. No reprocessing when your understanding evolves. Athena reads the raw files in place. The interpretation is a view, not a migration.
Make the classification cheap to change. A CASE expression in a SQL view costs nothing to update. A Lambda enrichment function costs a deploy, a test, a rollback plan. Keep the logic where it’s easiest to change.
Composability over completeness. Small functions that pipe together. traffic_search | -o json | upload_dataset. Each piece works alone and composes with others. No platform, no framework, no abstraction layer between you and the data.
The result is a style of observability that grows with your curiosity rather than your infrastructure budget.
The Series
#1: Build a Live API From AWS Documentation
Scrape AWS Lambda runtimes, cache at the edge, serve as JSON. One shell function, one CloudFront behavior, one endpoint.
Stack: bash + curl + sed → Lambda → CloudFront cache → JSON endpoint
#2: Browser Events to S3 Data Lake in Bash
First-party web analytics with zero dependencies. Browser fetch → bash Lambda → curl SigV4 → SNS → Firehose → partitioned S3 → Athena.
Stack: JavaScript client → Lambda (bash) → SNS → Firehose → S3 → Athena
#3: GitHub Commit History as a Queryable Dataset
Collect all your commits across orgs, users, and collaborator repos. Merge into a single dataset. Visualize engineering cadence.
Stack: gh + jq → JSONL → merge → S3 → Grafana Infinity
#4: Mapping the Terraform Module Ecosystem
Crawl the entire Terraform AWS module registry. Extract structural metadata from source code. Analyze composition patterns.
Stack: curl + jq → registry crawl → terraform-config-inspect → S3 → Grafana
#5: Slicing CloudFront Logs
Composable shell functions that slice CloudFront logs by any dimension. Terminal visualization with goaccess. JSON export to Grafana.
Stack: S3 sync → awk filters → goaccess → JSON → S3 → Grafana
#6: Build a Visibility Layer
Why JavaScript analytics have a blind spot, and how CloudFront logs fill it. The architecture decision behind agent and access_type — two derived dimensions that turn raw requests into meaningful signals.
Stack: CloudFront logs → S3 → Glue → Athena view → Grafana
#7: From Logs to Signals
Step-by-step implementation of the visibility layer. Standard Logging v2, Glue external table with partition projection, the Athena semantic view with full bot classification across three derived columns: agent, access_type, and crawler.
Stack: CloudFront Standard Logging v2 → Glue partition projection → Athena CASE classification → Grafana
#8: Measuring Publication
Publication events as Grafana annotations — a vertical line across every time-series panel the moment an article goes live. With publication events, CloudFront logs, and GSC data in the same Athena context, the full propagation chain becomes measurable: T₀ publish → Google-InspectionTool → Googlebot → search impressions → LLM retrieval → human clicks.
Stack: GitHub Actions → publish.sh → SNS → Firehose → S3 → Athena → Grafana annotations
Shared Infrastructure
Every signal uses the same building blocks:
| Component | Role |
|---|---|
| terraform-aws-lambda-function | Serverless compute |
| terraform-aws-lambda-shell-runtime-layer | Bash execution environment |
| terraform-aws-analytics-pipeline | SNS → Firehose → S3 |
upload_dataset (shared lib) | S3 upload for static datasets |
| CloudFront + S3 OAC | Global delivery of static JSON |
| Grafana Infinity | JSON datasource with JQ parsing |
The Repository
All code lives in cloudless-signals:
scripts/
├── lib.sh            # Shared: upload_dataset
├── fetch-modules.sh  # Terraform registry crawler
├── git-history.sh    # GitHub commit collection
└── goaccess.sh       # CloudFront log analysis
Each script is designed to be sourced — functions become available in your shell. Run them interactively, pipe outputs, compose workflows.
Design Principles
- Shell-first — curl, jq, awk, gh.
- Static datasets — JSON files in S3, served via CloudFront.
- Composable — small functions that pipe together.
- Explore locally, visualize remotely — terminal for discovery, Grafana for dashboards.
- Append-only — collect facts, query later.
Part of the cloudless ecosystem — infrastructure without the infrastructure.