Building a Production Observability Stack on AWS with OpenTelemetry and Grafana Tempo
How we built a lightweight, cost-effective distributed tracing platform for our automation ecosystem using ECS Fargate, S3, and the OpenTelemetry standard.
The Problem
We run a fleet of event-driven services — APIs, workers, and session managers — operating as loosely coupled microservices on AWS. When a multi-step workflow fails deep in the chain, we need to know exactly where and why.
Traditional logging gives you fragments. What we needed was end-to-end visibility: a single trace that follows a request from ingestion through every service boundary, queue hop, and API call until completion or failure.
Design Principles
We optimised for three things:
- Minimal operational overhead — no self-managed clusters, no Kubernetes
- Near-zero cost at low volume — pay only for what we trace
- Standard instrumentation — OpenTelemetry everywhere, no vendor lock-in
Architecture
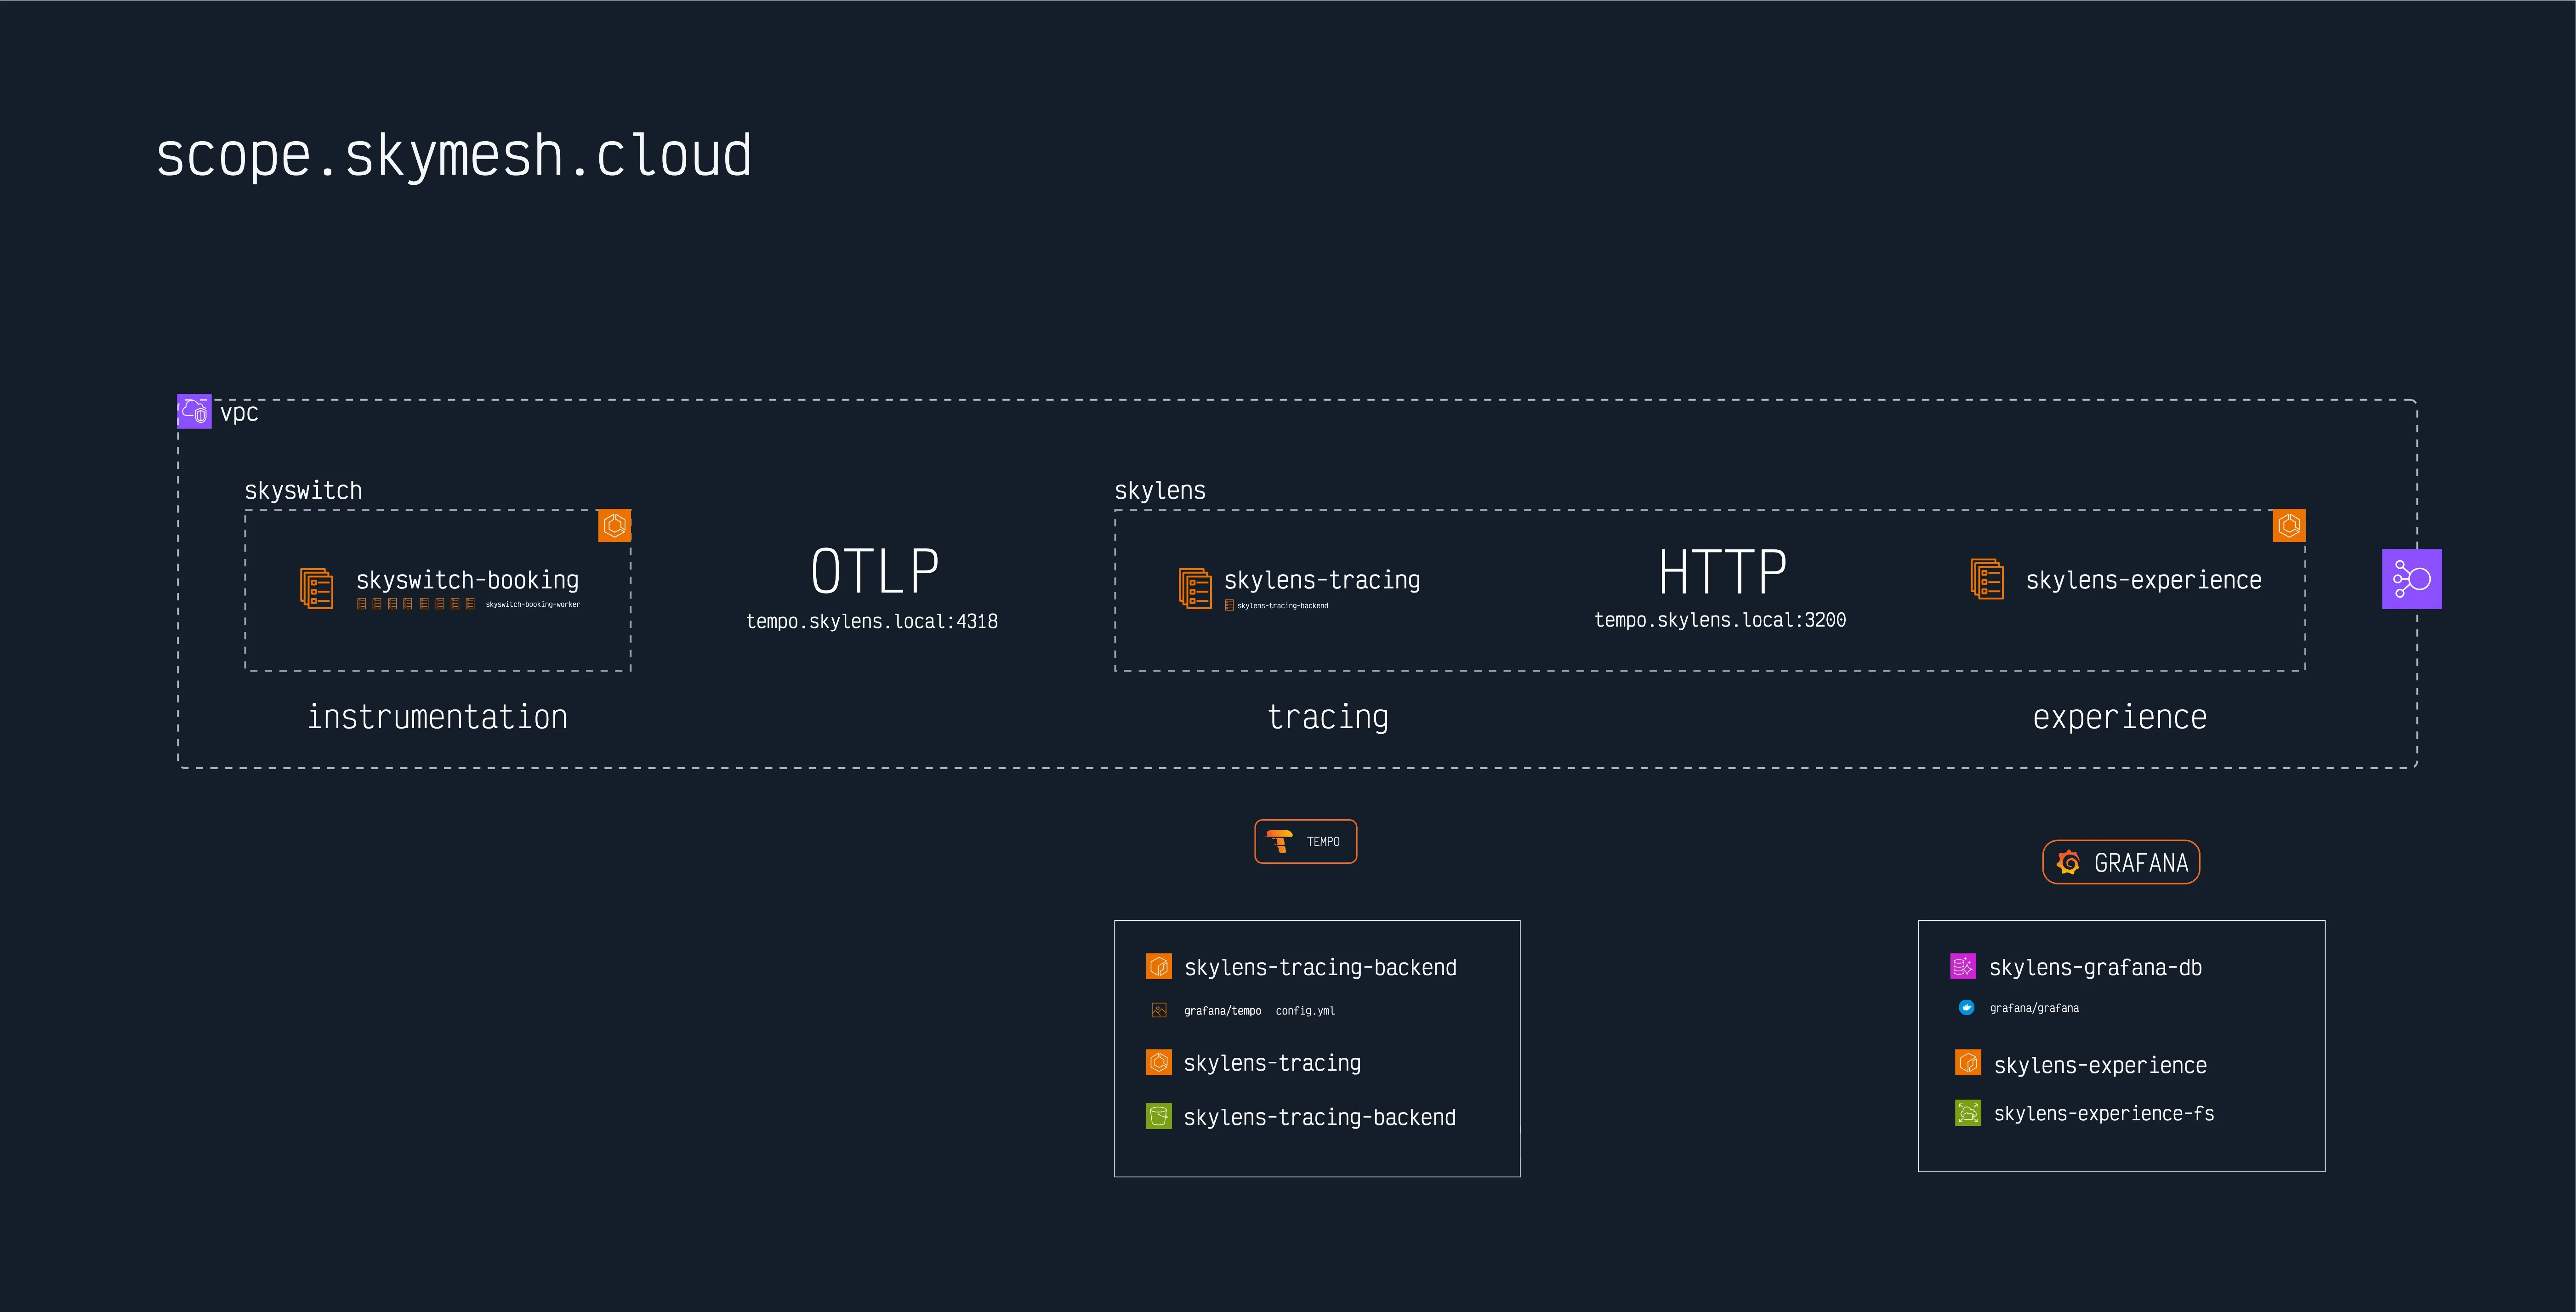
The entire stack runs as two ECS services in a dedicated observability cluster, sharing a VPC with our execution workloads.
Why a Dedicated Cluster
We deliberately separate observability from execution:
- Resource isolation — trace ingestion spikes don’t starve booking workers
- Independent scaling — scale based on trace volume, not business load
- Blast radius — if Grafana crashes, bookings keep running
- Cost visibility — clear per-cluster billing in CloudWatch
Both clusters share the same VPC, so OTLP exports travel over private networking with sub-millisecond latency and zero data transfer costs.
Tempo: The Tracing Backend
We chose Grafana Tempo for one reason: it only needs object storage. No Cassandra, no Elasticsearch, no operational complexity.
Deployment:
- ECS Fargate Spot (ARM64) — ~70% cheaper than on-demand x86
- 1 vCPU / 2 GB RAM — more than enough for our current volume
- Monolithic mode — single container handles ingestion, compaction, and queries
Storage:
- S3 bucket with 90-day retention
- Compressed trace blocks, typically pennies per month
- No versioning — traces are ephemeral by nature
Service Discovery:
- AWS Cloud Map provides private DNS
- Services reach Tempo at a predictable internal hostname on port 4318
- 10-second TTL, no load balancer needed for internal traffic
Instrumentation
Our services happen to use the OpenTelemetry Node.js SDK, but the same pattern works in any supported language — Go, Python, Java, Rust, .NET, and more. The instrumentation is identical in concept: configure an OTLP exporter and point it at Tempo.
const { NodeSDK } = require('@opentelemetry/sdk-node');
const { OTLPTraceExporter } = require('@opentelemetry/exporter-trace-otlp-http');

const sdk = new NodeSDK({
  resource: resourceFromAttributes({
    [ATTR_SERVICE_NAME]: process.env.OTEL_SERVICE_NAME,
    [ATTR_SERVICE_VERSION]: '1.0.0',
  }),
  traceExporter: new OTLPTraceExporter({
    url: process.env.OTEL_EXPORTER_OTLP_TRACES_ENDPOINT,
  }),
});

sdk.start();
No collector sidecar. No agent. Services export directly to Tempo over the private network. This keeps the architecture simple and eliminates an entire layer of infrastructure to manage.
What gets traced automatically:
- HTTP requests and responses
- External API calls
- Database queries
- SQS message processing
Custom spans wrap business logic — booking steps, token extractions, price comparisons — giving us domain-level visibility without drowning in low-level noise.
Visualization
Grafana runs as a second ECS service behind an ALB with HTTPS termination:
- ACM certificate on a custom domain
- Tempo pre-configured as a datasource
- Infinity plugin for querying external APIs directly from dashboards
The SQLite lesson: We initially used EFS for Grafana persistence. SQLite on a network filesystem is a recipe for corruption. We’re migrating to Aurora PostgreSQL Serverless — the only component where we’ll accept a managed database cost, because dashboard state actually matters.
Local Development
Developers run the same stack locally via Docker Compose:
docker-compose up -d  # Tempo + Grafana, file-backed storage
export OTEL_EXPORTER_OTLP_TRACES_ENDPOINT=http://localhost:4318/v1/traces
Same instrumentation code, same trace format, same Grafana queries. The only difference is the endpoint URL, controlled by an environment variable.
Cost Breakdown
At our current scale, the entire observability stack costs under $20/month:
| Component | Monthly Cost |
|---|---|
| Tempo (Fargate Spot, ARM64) | ~$8-12 |
| S3 trace storage | ~$0.01-1 |
| Grafana (Fargate Spot) | ~$8-12 |
| Service Discovery | ~$1 |
| ALB (shared) | amortised |
Compare this to any managed APM solution at $50-200+/month for similar trace volumes.
What’s Next
The dedicated cluster is designed to grow into a full observability suite:
- Metrics (Grafana Mimir) — replacing scattered CloudWatch dashboards
- Logs (Grafana Loki) — structured log aggregation with trace correlation
- Alerting — Grafana-native alerts replacing CloudWatch alarms
Each becomes another ECS service in the same cluster, sharing the same S3 backend pattern and service discovery namespace.
Key Takeaways
-
You don’t need Kubernetes for production observability. ECS Fargate with Cloud Map gives you service discovery and container orchestration without the operational tax.
-
Tempo + S3 is absurdly cheap. If you only need tracing (not metrics or logs), Tempo eliminates the need for any database.
-
Skip the collector at small scale. Direct OTLP export from services to Tempo removes an entire infrastructure layer. Add a collector when you need sampling, routing, or multi-backend fanout.
-
Separate observability from execution. When your tracing backend has a bad day, your revenue-generating services shouldn’t notice.
-
ARM64 + Spot is the sweet spot. Observability workloads are stateless and interruption-tolerant — perfect for Spot pricing on Graviton.
This is part of our series on building shell-first, event-driven infrastructure on AWS without the complexity tax of traditional platforms.