Mastering ECS Autoscaling: Target Tracking, Step, and Scheduled Together
Autoscaling in AWS ECS looks straightforward at first glance — “just add a target tracking policy and you’re done.”
But in practice, it’s full of nuance. Over the past weeks I’ve been experimenting with real workloads, real queues, and real ECS services, and I’ve learned that you need more than one lever to get it right.
This post walks through how I combined Target Tracking, Step Scaling, and Scheduled Scaling to build a resilient and cost-effective autoscaling setup — and the unexpected lessons I learned along the way.
Introduction
By default, ECS autoscaling often relies on CPU or memory utilization metrics to adjust the number of running tasks. While this works well for many applications, queue-driven workloads require a more nuanced approach. Instead of just resource usage, scaling based on the backlog of work waiting in the queue provides a more accurate reflection of demand. A common pattern is to use a custom metric like backlog-per-task (e.g., messages per running task) to ensure the number of tasks matches the amount of work, enabling more precise and efficient scaling. This approach is especially useful because it accounts for the variable nature of demand—if demand were constant, you could simply size your tasks once and forget about scaling, but in reality, demand fluctuates, so dynamic scaling is required.
Example Scenario
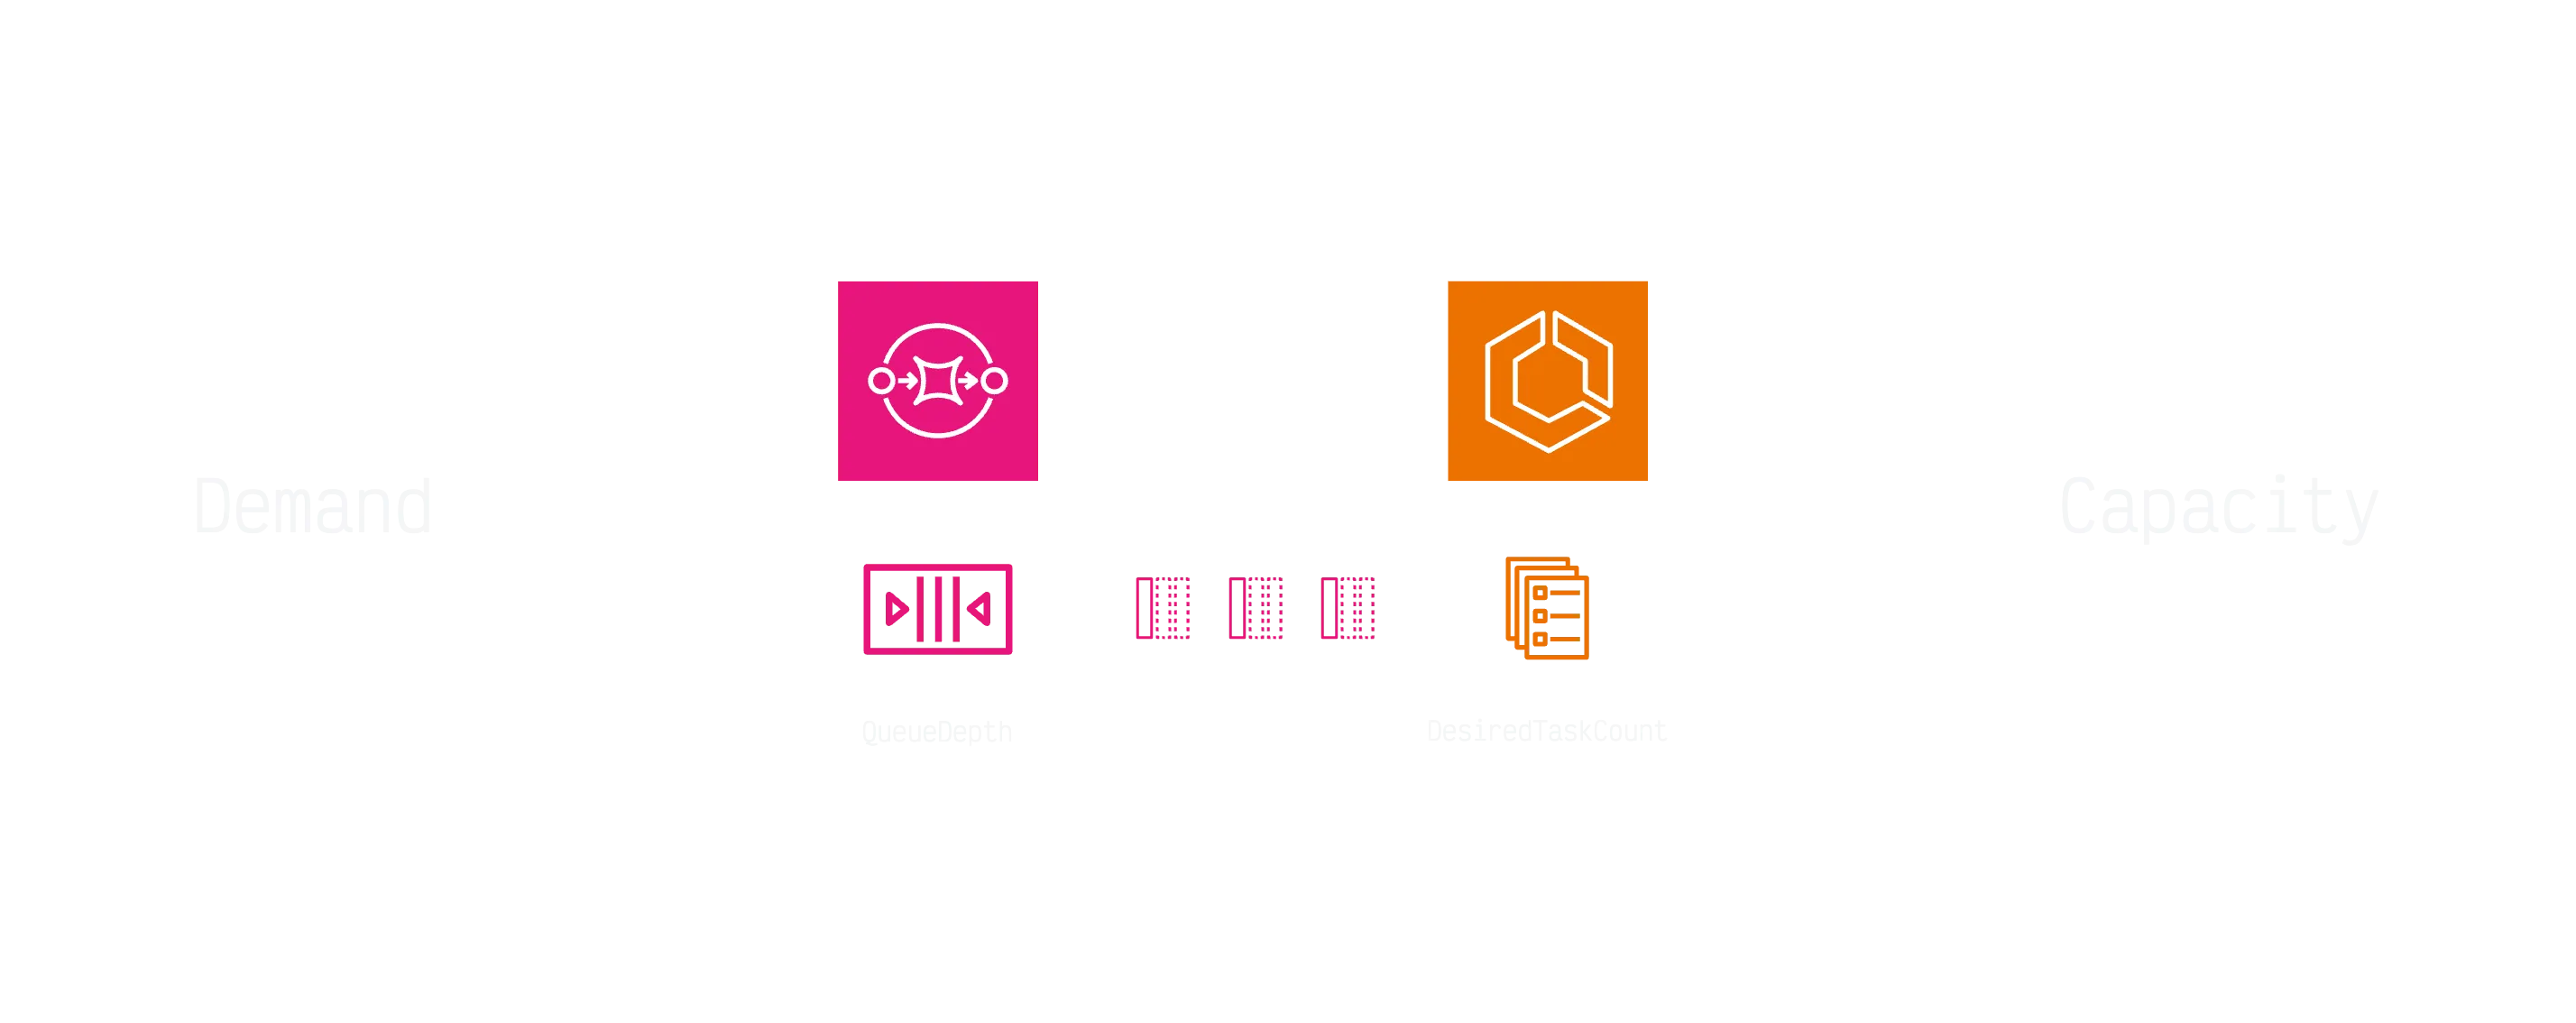
The workload is queue-driven:
- Demand: measured by
QueueDepth(ApproximateNumberOfMessagesVisible) - Capacity: measured by
DesiredTaskCount/RunningTaskCountfrom ECS
The core idea: scale ECS workers up or down so that the number of running tasks matches the amount of work waiting in the queue.
Goal: keep backlog low, keep latency under control, minimize cost.
Target Tracking Policy
Target Tracking provides a way to automatically adjust the number of running tasks based on a custom metric that reflects the workload per task.
resource "aws_appautoscaling_policy" "ecs_default" {
  name               = "${local.pascal_prefix}AvailabilityAutoscalingPolicy"
  policy_type        = "TargetTrackingScaling"
  scalable_dimension = aws_appautoscaling_target.ecs_default.scalable_dimension
  resource_id        = aws_appautoscaling_target.ecs_default.resource_id
  service_namespace  =  aws_appautoscaling_target.ecs_default.service_namespace

  target_tracking_scaling_policy_configuration {
    target_value = 1  # 1 task per message
    disable_scale_in = false
    scale_in_cooldown = 0
    scale_out_cooldown = 180

    # Backlog per task - considers both queue depth AND running tasks
    customized_metric_specification {
      metrics {
        label = "ApproximateNumberOfMessagesVisible"
        id    = "m1"
        metric_stat {
          metric {
            metric_name = "ApproximateNumberOfMessagesVisible"
            namespace   = "AWS/SQS"
            dimensions {
              name  = "QueueName"
              value = "${aws_sqs_queue.default.name}"
            }
          }
          stat = "Sum"
        }
        return_data = false
      }
      metrics {
        label = "ApproximateNumberOfMessagesNotVisible"
        id    = "m3"
        metric_stat {
          metric {
            metric_name = "ApproximateNumberOfMessagesNotVisible"
            namespace   = "AWS/SQS"
            dimensions {
              name  = "QueueName"
              value = "${aws_sqs_queue.default.name}"
            }
          }
          stat = "Sum"
        }
        return_data = false
      }
      metrics {
        label = "RunningTaskCount"
        id    = "m2"
        metric_stat {
          metric {
            metric_name = "RunningTaskCount"
            namespace   = "ECS/ContainerInsights"
            dimensions {
              name  = "ClusterName"
              value = "${local.ecs_cluster_name}"
            }
            dimensions {
              name  = "ServiceName"
              value = "${aws_ecs_service.default.name}"
            }
          }
          stat = "Maximum"
        }
        return_data = false
      }
      metrics {
        label       = "SafeRunningTaskCount"
        id          = "f1"
        expression  = "FILL(FILL(m2,REPEAT),0)"
        return_data = false
      }
      metrics {
        label       = "backLogPerTask"
        id          = "e1"
        expression  = "IF(f1 > 0, (m1 + m3) / f1, m1 + m3)"
        return_data = true
      }
    }
  }
}
Why this Target Tracking policy (reasoning)
This policy implements backlog-per-task as the control metric and then applies Target Tracking to keep it near a chosen set‑point.
Metric composition
- Backlog =
ApproximateNumberOfMessagesVisible + ApproximateNumberOfMessagesNotVisible
Using both captures waiting and in-flight messages, which better reflects real work remaining than visible-only depth. - Capacity =
RunningTaskCountfromECS/ContainerInsightsscoped to the service.
We then compute:
so that when capacity is zero we don’t divide by zero and the metric equals the backlog.IF(RunningTaskCount > 0, Backlog / RunningTaskCount, Backlog) - FILL(REPEAT, 0) is applied to
RunningTaskCountto avoid gaps and transientnullsamples that would otherwise stall Target Tracking decisions.
Why target_value = 1
- The set‑point represents messages per running task. A value of
1means: on average, each task should have roughly one message to work on. - You can derive a principled target from your latency budget L (seconds) and average processing time per message T (seconds):
Example: if you can tolerate 10s queue latency and tasks process a message in 0.1s,target_value ≈ L / T (messages per task)target_value ≈ 100.
Cooldowns & stability
scale_out_cooldown = 180provides damping so the service doesn’t overreact to short spikes (ECS placement and image cold start also take time).scale_in_cooldown = 0lets the fleet shed capacity as soon as the signal allows, but in practice scale‑in remains conservative due to Target Tracking’s internal flapping protection.- If you observe oscillations, increase scale‑in cooldown (e.g., 300–600s) and/or widen the effective dead‑band by slightly lowering the target.
Why not queue depth alone
- Raw
ApproximateNumberOfMessagesVisibleignores current capacity; 1,000 messages with 2 tasks is not the same as 1,000 messages with 50 tasks. Backlog‑per‑task normalizes by capacity and produces proportional behavior.
Stat/period choices
- Using
stat = Sumon 60s periods is a good default for SQS depth. If your producers are very bursty, consider 30s periods and apply light smoothing in the reader to reduce one‑sample noise.
About the Alarms
When you attach a Target Tracking policy, AWS automatically creates the necessary CloudWatch alarms (both upper and lower thresholds) that drive the scaling actions. These alarms have their datapoint-to-alarm and evaluation periods carefully tuned to work optimally with the scaling algorithm. It is generally better not to override these alarms directly. Instead, adjust the target value of the policy—which can be a floating point number—to find the right balance between responsiveness and stability for your workload.
If you’re curious what Target Tracking is doing under the hood, you can use the AWS CLI to see the exact CloudWatch alarms it generates:
aws application-autoscaling describe-scaling-policies \
    --policy-names Ql4bAirswitchRyanairAvailabilityAutoscalingPolicy \
    --service-namespace ecs \
    | jq \
    '.ScalingPolicies|first.Alarms'
[
{
"AlarmName": "TargetTracking-service/arn:aws:ecs:eu-central-1:703177223665:cluster/ql4b-airswitch/ql4b-airswitch-ryanair-AlarmHigh-3712aff2-5d0a-40fb-a92e-7ca8d34631da",
"AlarmARN": "arn:aws:cloudwatch:eu-central-1:703177223665:alarm:TargetTracking-service/arn:aws:ecs:eu-central-1:703177223665:cluster/ql4b-airswitch/ql4b-airswitch-ryanair-AlarmHigh-3712aff2-5d0a-40fb-a92e-7ca8d34631da"
},
{
"AlarmName": "TargetTracking-service/arn:aws:ecs:eu-central-1:703177223665:cluster/ql4b-airswitch/ql4b-airswitch-ryanair-AlarmLow-90f5b055-3d73-4c45-af2d-21054f8e6f36",
"AlarmARN": "arn:aws:cloudwatch:eu-central-1:703177223665:alarm:TargetTracking-service/arn:aws:ecs:eu-central-1:703177223665:cluster/ql4b-airswitch/ql4b-airswitch-ryanair-AlarmLow-90f5b055-3d73-4c45-af2d-21054f8e6f36"
}
]aws cloudwatch describe-alarms \
--alarm-names TargetTracking-service/arn:aws:ecs:eu-central-1:703177223665:cluster/ql4b-airswitch/ql4b-airswitch-ryanair-AlarmHigh-3712aff2-5d0a-40fb-a92e-7ca8d34631da TargetTracking-service/arn:aws:ecs:eu-central-1:703177223665:cluster/ql4b-airswitch/ql4b-airswitch-ryanair-AlarmLow-90f5b055-3d73-4c45-af2d-21054f8e6f36 \
| jq '
.MetricAlarms[]|{
AlarmActions,
EvaluationPeriods,
Threshold,
ComparisonOperator,
AlarmDescription,
AlarmName,
TrackingMetric:.Metrics[]|select(.ReturnData == true)
}'{
"AlarmActions": [
"arn:aws:autoscaling:eu-central-1:703177223665:scalingPolicy:c21da43a-bdbf-4ece-924e-f66ecdce25cb:resource/ecs/service/arn:aws:ecs:eu-central-1:703177223665:cluster/ql4b-airswitch/ql4b-airswitch-ryanair:policyName/Ql4bAirswitchRyanairAvailabilityAutoscalingPolicy:createdBy/cb04dcaa-1f20-4fea-84e0-cb3f109d9138"
],
"EvaluationPeriods": 3,
"Threshold": 1.0,
"ComparisonOperator": "GreaterThanThreshold",
"AlarmDescription": "DO NOT EDIT OR DELETE. For TargetTrackingScaling policy arn:aws:autoscaling:eu-central-1:703177223665:scalingPolicy:c21da43a-bdbf-4ece-924e-f66ecdce25cb:resource/ecs/service/arn:aws:ecs:eu-central-1:703177223665:cluster/ql4b-airswitch/ql4b-airswitch-ryanair:policyName/Ql4bAirswitchRyanairAvailabilityAutoscalingPolicy:createdBy/cb04dcaa-1f20-4fea-84e0-cb3f109d9138.",
"AlarmName": "TargetTracking-service/arn:aws:ecs:eu-central-1:703177223665:cluster/ql4b-airswitch/ql4b-airswitch-ryanair-AlarmHigh-3712aff2-5d0a-40fb-a92e-7ca8d34631da",
"TrackingMetric": {
"Id": "e1",
"Expression": "IF(f1 > 0, (m1 + m3) / f1, m1 + m3)",
"Label": "backLogPerTask",
"ReturnData": true,
"Period": 60
}
}
{
"AlarmActions": [
"arn:aws:autoscaling:eu-central-1:703177223665:scalingPolicy:c21da43a-bdbf-4ece-924e-f66ecdce25cb:resource/ecs/service/arn:aws:ecs:eu-central-1:703177223665:cluster/ql4b-airswitch/ql4b-airswitch-ryanair:policyName/Ql4bAirswitchRyanairAvailabilityAutoscalingPolicy:createdBy/cb04dcaa-1f20-4fea-84e0-cb3f109d9138"
],
"EvaluationPeriods": 15,
"Threshold": 0.9,
"ComparisonOperator": "LessThanThreshold",
"AlarmDescription": "DO NOT EDIT OR DELETE. For TargetTrackingScaling policy arn:aws:autoscaling:eu-central-1:703177223665:scalingPolicy:c21da43a-bdbf-4ece-924e-f66ecdce25cb:resource/ecs/service/arn:aws:ecs:eu-central-1:703177223665:cluster/ql4b-airswitch/ql4b-airswitch-ryanair:policyName/Ql4bAirswitchRyanairAvailabilityAutoscalingPolicy:createdBy/cb04dcaa-1f20-4fea-84e0-cb3f109d9138.",
"AlarmName": "TargetTracking-service/arn:aws:ecs:eu-central-1:703177223665:cluster/ql4b-airswitch/ql4b-airswitch-ryanair-AlarmLow-90f5b055-3d73-4c45-af2d-21054f8e6f36",
"TrackingMetric": {
"Id": "e1",
"Expression": "IF(f1 > 0, (m1 + m3) / f1, m1 + m3)",
"Label": "backLogPerTask",
"ReturnData": true,
"Period": 60
}
}See it Working (Hands-On)

The Problem
A few challenges appear when relying only on the standard AWS baseline approach — scaling based on CPU/memory or backlog-per-task target tracking alone:
- Cold start lag: scaling from 0 tasks to 1 task is slow (metrics take 2–3 minutes to register)
- Flapping: target tracking policies can oscillate if cooldowns aren’t tuned
- Business-hour workloads: leaving capacity at 1 task overnight wastes money
These issues require more than just a single target tracking policy.
The Challenge: Availability vs Reactivity
- Target Tracking is designed for stability, not speed.
- With
min_capacity = 0, scale-out from cold start can take 2–3 minutes due to metric lag. - Customers don’t care about metrics — they care about response time.
That’s when you realize: one scaling policy isn’t enough.
Target Tracking — The Baseline
Target tracking works best as the “cruise control” for your service:
- Uses a backlog-per-task metric (
Messages / RunningTasks). - Scales smoothly up and down, one task at a time.
- Conservative by design — avoids overshoot.
⚠️ Lesson learned: Be careful with flapping detection. The algorithm suppresses actions if it sees rapid in/out oscillations. Cooldowns and target values must be tuned to keep it responsive.
Step Scaling — Solving 0 → 1
Target tracking fails at cold start, so I added a step scaling alarm:
- Trigger: If
RunningTasks == 0andQueue > 0→ add 1 task. - Cooldown: 120 seconds.
- Purpose: bootstrap the service quickly when it’s asleep.
This small rule makes a huge difference in perceived responsiveness.
Scheduled Scaling — Predictable Baseline
Not all workloads are random. Mine had clear business-hour patterns:
- 9am Mon–Fri → ensure at least 1 task (warm baseline).
- 11pm Mon–Fri → allow scale-to-zero (cost optimization).
By scheduling, I eliminated the worst cold-start delays right when users are active.
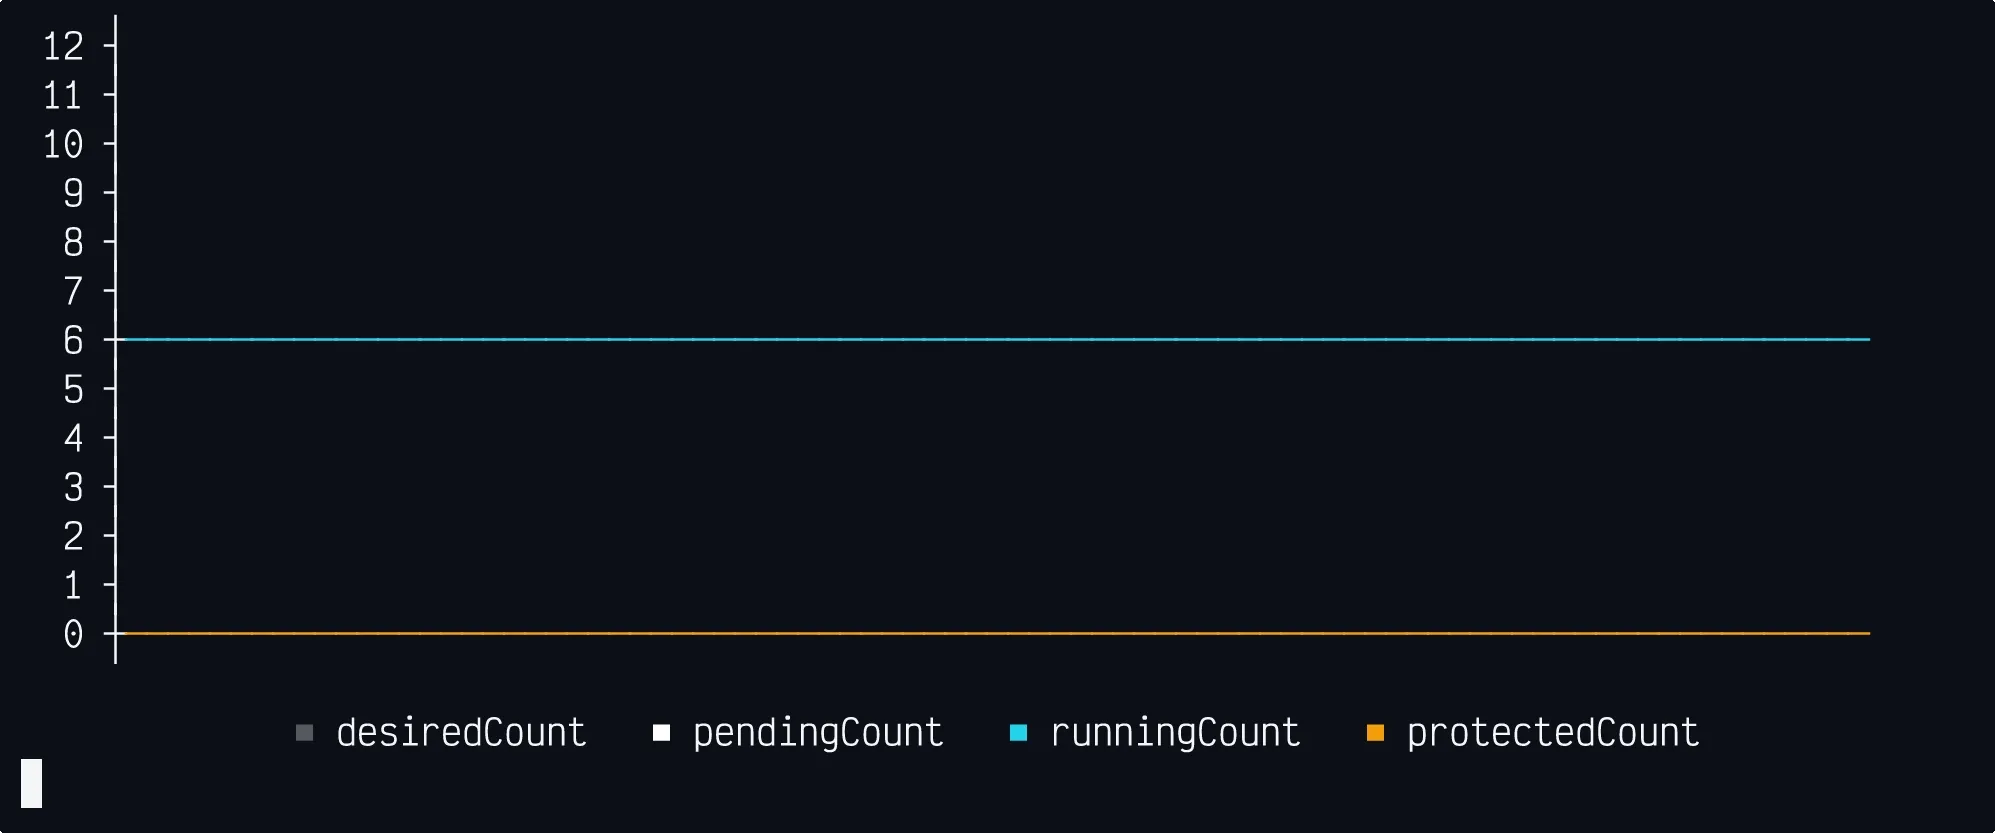
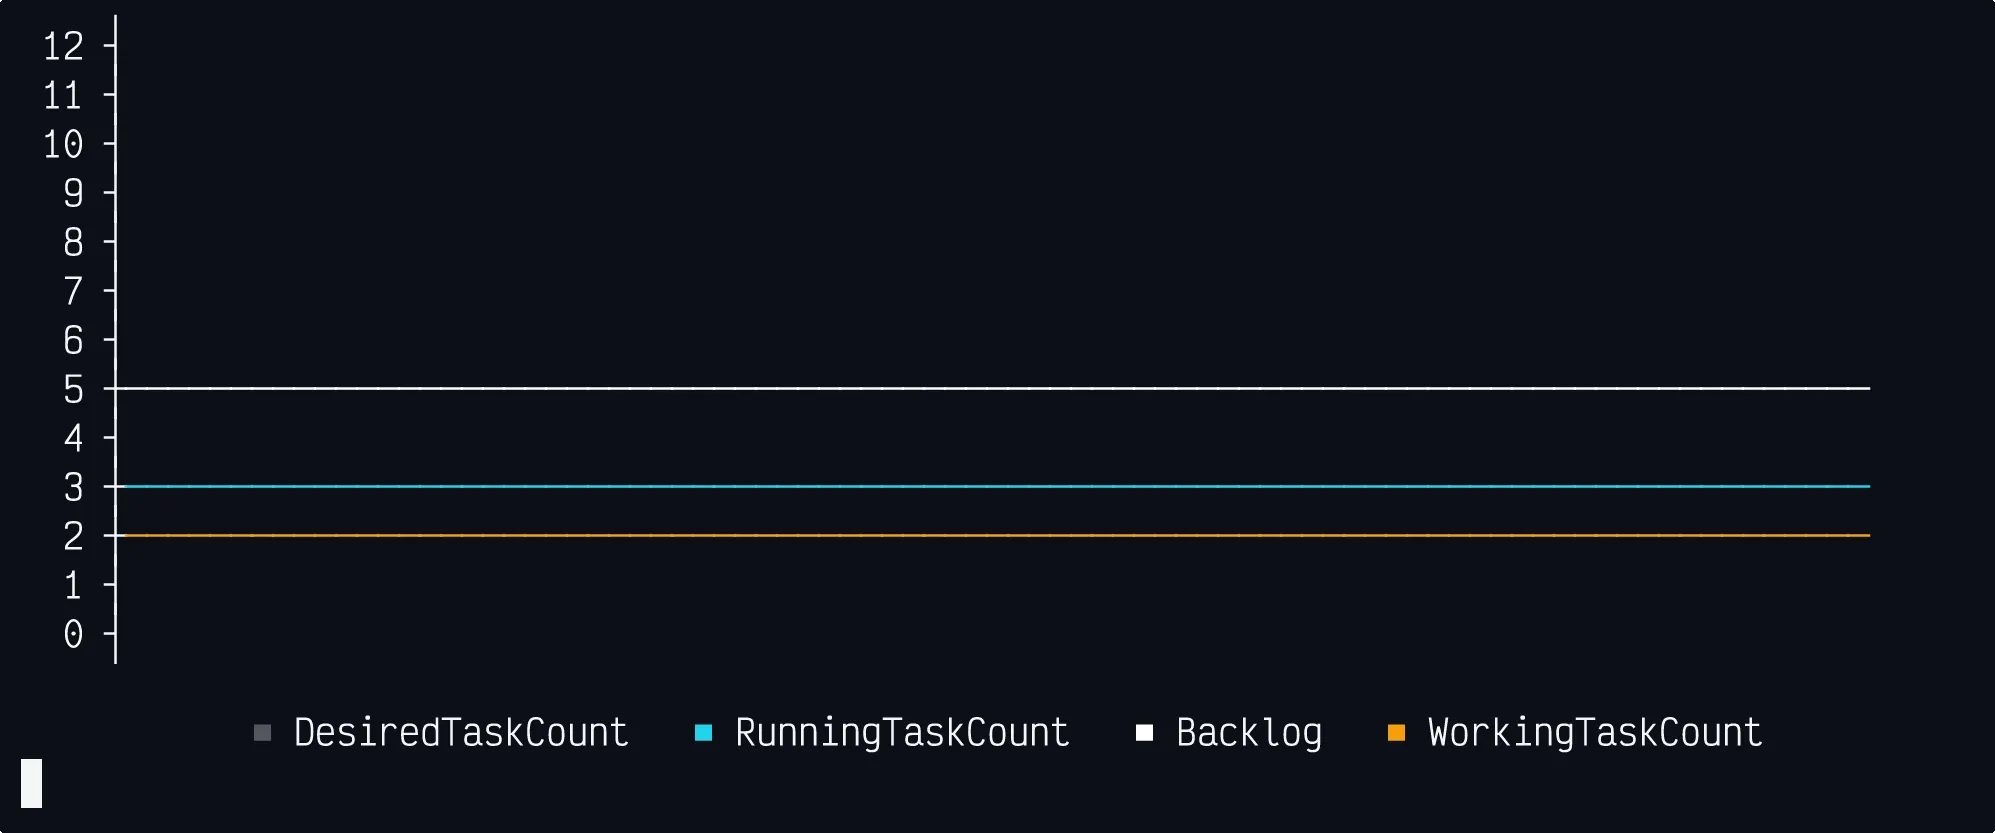
Visualizing Scaling in the Terminal
Instead of dashboards, I used asciigraph and asciinema to watch metrics in real time from the terminal.
This turned out to be incredibly useful — seeing the queue depth rise, tasks spin up, and autoscaling react gave me intuition that CloudWatch graphs alone don’t show.

Lessons Learned
- Target Tracking keeps things balanced, but don’t expect fast wake-ups.
- Step Scaling is essential for cold-start responsiveness.
- Scheduled Scaling saves money while keeping service warm during peaks.
- Observability (even in ASCII!) builds intuition you can’t get from alarms alone.
References
- https://aws.amazon.com/blogs/containers/amazon-elastic-container-service-ecs-auto-scaling-using-custom-metrics/
- https://serverlessland.com/patterns/sqs-ecs-autoscaling?ref=search
- https://aws.amazon.com/blogs/compute/scaling-an-asg-using-target-tracking-with-a-dynamic-sqs-target/
Other articles
- https://adamtuttle.codes/blog/2022/scaling-fargate-based-on-sqs-queue-depth/
- https://github.com/hariohmprasath/ecs-event-driven-scaling
Closing Thoughts
Autoscaling isn’t about a single magic policy — it’s about combining strategies.
With this hybrid approach, I reached the sweet spot: responsive, stable, and cost-optimized ECS scaling.